🌐 The Multi-Environment Parity Conundrum: Why Contrib Modules Fail Modern DevOps (And What Architects Do Instead)
When software delivery spans containerized local workstations, isolated hypervisor sandboxes, and remote production clouds, standard CMS plugins hit a brick wall. Here is why the "contrib trap" happens—and how systems architects engineer clean, event-driven telemetry.
💡 Executive Summary & Core Insights
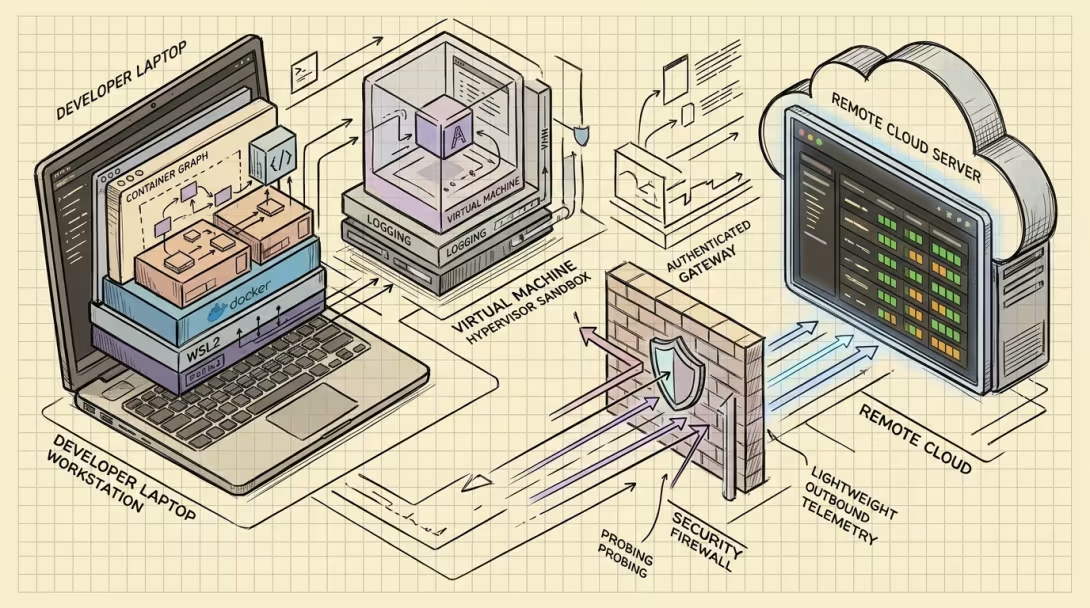
Every maturing engineering organization reaches a point where "local development" is no longer a simple single-stack LAMP setup on a laptop. In 2026, professional teams operate across a heterogeneous hybrid landscape:
1. Developer Workstations: Containerized stacks running inside Linux subsystems (Host WSL2 + DDEV / Docker Desktop).
2. Evaluation & Staging Sandboxes: Isolated virtual machines (Windows 11 Hyper-V with nested virtualization) used for destructive testing and onboarding.
3. Continuous Integration Runners: Ephemeral GitHub Actions runners.
4. Production Cloud: Managed VPS, shared host clusters, or containerized Kubernetes nodes.
In this article, we dissect and analyze a real-world production rollback crisis caused by hidden environment drift, and provide the blueprint for an event-driven, push-based parity matrix that bridges local workstations, sandbox VMs, and production cloud without enterprise software bloat.
🏛️ 1. The "Contrib Trap": Why Ecosystem Modules Fall Flat
When teams search package repositories (whether Drupal.org, WordPress plugins, or Packagist) for "environment status dashboard," they find established modules. But when subjected to architectural review, these tools immediately fail modern multi-workspace requirements.
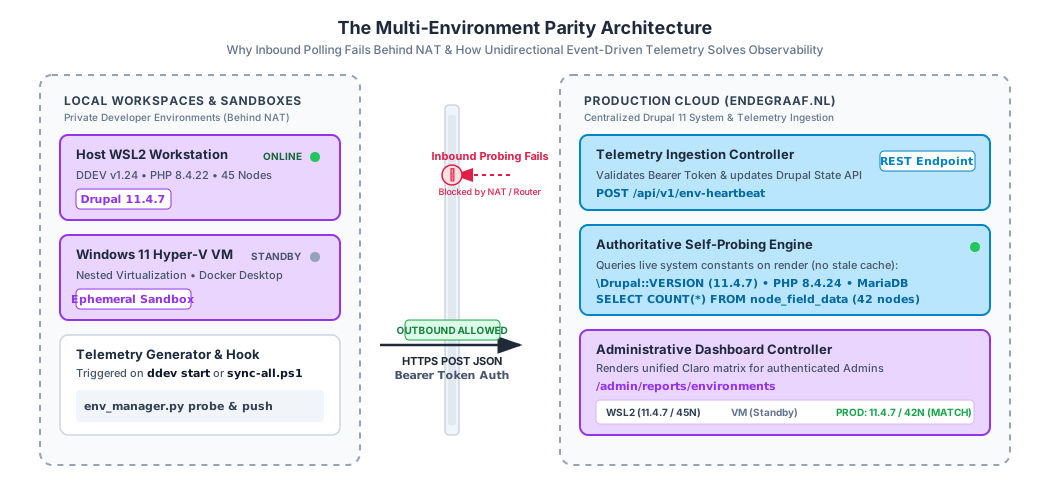
Figure 1: The Multi-Environment Parity Architecture—Illustrating why inbound probing fails behind local NAT boundaries and how unidirectional outbound heartbeats establish reliable observability.
Flaw A: The Inbound NAT & Firewall Perimeter Barrier
Traditional monitoring tools expect a central hub that reaches out to poll client nodes via HTTP or SSH.- In enterprise hosting, this works because servers have static IPs or VPC peering.
- In modern development, Host WSL2 and Hyper-V VMs sit behind residential or office NAT routers and local firewalls.
- A public production server cannot initiate a connection into a developer’s laptop to ask: "What version of PHP or Drupal are you running?" Doing so would require complex reverse SSH tunnels, VPN concentrators, or opening local router ports—a glaring security anti-pattern.
Flaw B: Monolithic Self-Centricity (The "Colored Ribbon" Fallacy)
The most popular environment module in the CMS world is Environment Indicator. It is a fantastic tool for what it was built to do: rendering a bright red bar on production and a green bar on local dev so developers don't accidentally edit live production data.However, it is strictly self-centric:
- It only knows what environment you are currently browsing in your browser session.
- It cannot aggregate, compare, or track other environments.
- It provides zero visibility into whether your local database content matches staging, or whether your DDEV container is three patch releases ahead of production.
Flaw C: Package Release Monitoring vs. Operational Parity
Modules like Status Dashboard implement a hub-and-spoke model, but their primary purpose is tracking upstream software releases (e.g., "Does drupal.org have a security update for module X?").
DevOps squads do not just need to know if an upstream security patch exists. They need to answer critical operational questions:
- Is Host WSL2 running the exact same core patch (
11.4.7) as the production cloud? - How many published content nodes exist in local DDEV vs. Production (
45vs.42)? - When was the last time the Hyper-V evaluation sandbox executed an automated sync?
⚠️ 2. Real-World War Story: The "Git Divergence & Production Rollback Trap"
Why is environment parity an architectural priority rather than a cosmetic dashboard?
Because without it, modern automated CI/CD pipelines turn into silent destruction engines.
Consider a real-world scenario encountered during site maintenance on endegraaf.nl:
sequenceDiagram
    autonumber
    participant Admin as "Site Administrator"
    participant Prod as "Production Server"
    participant Git as "GitHub (origin/main)"
    participant CI as "GitHub Actions Runner"

    Admin->>Prod: Executes out-of-band upgrade (Composer update to 11.4.7)
    Note over Prod: composer.lock and core/ updated on live disk
Changes remain UNCOMMITTED in Git
    Note over Git: origin/main is still stuck on 11.4.4

    Admin->>Git: Pushes a minor content update / blog post
    Git->>CI: Triggers automated deploy.yml workflow
    CI->>Prod: SSH: git fetch origin and git reset --hard origin/main
    Note over Prod: CRITICAL ROLLBACK: Tracked core/ files overwritten to 11.4.4!
Untracked 11.4.7 files remain orphaned. Site crashes.
The Incident Mechanics
1. The Out-of-Band Upgrade: An engineer rancomposer update directly on the cloud server, cleanly upgrading Drupal core from 11.4.4 to 11.4.7 and Symfony dependencies to v7.4.19.
2. The Partial Commit: The upgrade succeeded on disk, but only composer.lock was staged. The actual updated core/ directory files were left as uncommitted working tree changes on production.
3. The Silent Divergence: Upstream GitHub (origin/main) and the developer’s local workstation still tracked Drupal 11.4.4.
4. The Rollback Ambush: The production deployment workflow was configured with standard zero-touch automation:
   cd /var/www/drupal_01
   git fetch origin
   git reset --hard origin/main
drush crgit reset --hard origin/main. This wiped out the live 11.4.7 core files back to 11.4.4, leaving orphaned 11.4.7 classes and causing fatal class-loading mismatches.
The Architect's Takeaway
A multi-environment dashboard is not a vanity metric. It is an active circuit breaker. If the DevOps squad had an automated parity matrix, the divergence betweenorigin/main (11.4.4) and Production (11.4.7) would have flashed red before triggering a deployment.
⚖️ 3. The Architectural Decision Matrix: Build vs. Buy vs. Adapt
When DevOps squads bring this dilemma to systems architects, three architectural pathways emerge:
| Dimension | Enterprise APM (Datadog / New Relic) | Hacking Contrib Modules | Lightweight Event Telemetry (Architected Pattern) |
|---|---|---|---|
| Licensing Cost | High ($$$ per host / agent / month) | Free / Open Source | Free / Zero Overhead |
| NAT Traversal | Requires installed background daemon on all machines | Fails completely (inbound HTTP blocked) | Unidirectional outbound HTTPS POST (NAT-friendly) |
| CMS Context | Low (treats CMS as generic PHP process) | Moderate (understands Drupal, but not DDEV/VMs) | High (extracts live nodes, theme, Drush status) |
| Maintenance Drag | Agent upgrades, telemetry pipeline configuration | High technical debt; breaks on major Drupal bumps | Minimal (~60 lines of clean, native PHP controller) |
| Architecture Fit | Overkill for content & CMS applications | Ill-fitting square peg in round hole | Tailored, elegant, and resilient |
🛠️ 4. The Architected Solution: Unidirectional Push + Live Cloud Self-Probing
To solve the conundrum cleanly, we designed a Hybrid Telemetry Architecture based on two strict principles:
1. Unidirectional Outbound Heartbeats for Local Workspaces: Local machines push telemetry outbound on lifecycle events. Production never polls inbound.
2. Authoritative Real-Time Cloud Self-Probing: Production never trusts external reports about its own state. It probes its own live runtime constants upon page request.
sequenceDiagram
    autonumber
    participant Local as "Host WSL2 / Dev VM"
    participant Gateway as "POST /api/v1/env-heartbeat"
    participant State as "Drupal State API"
    participant UI as "Admin UI Reports"
    participant Engine as "Live Drupal Core Engine"

    Local->>Local: ddev start or sync-all.ps1 executes probe
    Local->>Gateway: HTTPS POST telemetry payload
    Note over Gateway: Validates Authorization Bearer token
    Gateway->>State: Store and merge JSON payload into Drupal State
    Gateway-->>Local: 200 OK (Heartbeat acknowledged)

    UI->>Engine: Admin accesses dashboard page
    Engine->>Engine: Dynamically query Drupal VERSION and entityQuery count
    Engine->>State: Fetch latest telemetry for WSL2 and VM
    Engine-->>UI: Render unified, authoritative Claro matrix table
Component 1: The Local Event-Driven Hook (env_manager.py)
Rather than running background daemons, telemetry generation is tied directly to existing developer lifecycle events:
- When a developer starts their local environment (
ddev start), a post-start hook executes. - When running the cross-environment sync tool (
.\drupal-devtools\sync-all.ps1 -Action Status), the script probes local container state and securely transmits the payload:
def push_telemetry_to_cloud(matrix_data, api_token):
    """Securely push local environment telemetry to central cloud endpoint."""
    url = "https://endegraaf.nl/api/v1/env-heartbeat"
    headers = {
        "Authorization": f"Bearer {api_token}",
        "Content-Type": "application/json",
        "User-Agent": "EndegraafEnvTelemetry/1.0"
    }
    payload = json.dumps({"environments": matrix_data}).encode("utf-8")
    req = urllib.request.Request(url, data=payload, headers=headers, method="POST")
    try:
        with urllib.request.urlopen(req, timeout=5) as resp:
            return resp.status == 200
    except Exception as e:
        print(f"[WARN] Telemetry push skipped: {e}")
        return False
Component 2: The Ingestion REST Controller (HeartbeatController.php)
A tiny, high-performance controller inside a custom module (modules/custom/endegraaf_env_dashboard) handles ingestion:
- Zero Database Schema Overhead: Telemetry is stored directly in Drupal's native key-value
State API(\Drupal::state()), eliminating database migrations. - Token Authentication: Requests must present a valid Bearer token matching the environment secret:
namespace Drupal\endegraaf_env_dashboard\Controller;

use Symfony\Component\HttpFoundation\JsonResponse;
use Symfony\Component\HttpFoundation\Request;
use Drupal\Core\Controller\ControllerBase;

class HeartbeatController extends ControllerBase {

  public function receiveHeartbeat(Request $request): JsonResponse {
    $authHeader = $request->headers->get('Authorization', '');
    $expectedToken = \Drupal::state()->get('endegraaf_env_dashboard.token');

    if (empty($expectedToken) || $authHeader !== 'Bearer ' . $expectedToken) {
      return new JsonResponse(['error' => 'Unauthorized'], 403);
    }

    $payload = json_decode($request->getContent(), TRUE);
    if (!empty($payload['environments'])) {
      $stored = \Drupal::state()->get('endegraaf_env_dashboard.matrix', []);
      foreach ($payload['environments'] as $env) {
        $stored[$env['id']] = $env;
      }
      \Drupal::state()->set('endegraaf_env_dashboard.matrix', $stored);
      return new JsonResponse(['status' => 'acknowledged', 'count' => count($stored)]);
    }

    return new JsonResponse(['error' => 'Invalid payload'], 400);
  }
}
Component 3: Live Cloud Self-Probing (DashboardController.php)
When an administrator loads the dashboard at /admin/reports/environments, production calculates its own metrics in real time rather than reading a static file:
// Query live runtime directly on page render:
$currentCoreVersion = \Drupal::VERSION;          // Evaluates to: 11.4.7
$currentPhpVersion  = phpversion();             // Evaluates to: 8.4.24
$currentNodeCount   = \Drupal::entityQuery('node')
  ->accessCheck(FALSE)
  ->count()
  ->execute();                                  // Evaluates to: 42
📋 5. Architectural Principles for DevOps Squads
When architecting observability across multi-tier developer workflows, adhere to these four core rules:
1. Invert the Network Dependency (Push, Never Poll)
Never design an observability system that relies on central servers initiating inbound connections into developer machines. Developer workstations are ephemeral, firewalled, and mobile. Use outbound HTTPS push attached to CLI lifecycle events (ddev start, git commit, composer install).
2. Isolate Version Parity from Package Security
Do not confuse upstream vulnerability tracking (what Drupal core updates are available on drupal.org) with workspace deployment parity (whether local dev matches cloud production). Use native core update reports for the former, and lightweight telemetry matrices for the latter.3. Match Telemetry Cadence to Operational Risk
You do not need sub-second streaming metrics for CMS version parity. Emitting heartbeats upon environment startup or manual synchronization keeps network traffic close to zero while guaranteeing that discrepancies are caught before code is merged.4. Guard Your Git SOT (Single Source of Truth)
If an environment can executegit reset --hard origin/main in automated pipelines, no production runtime change is safe until it is committed to Git. Telemetry dashboards are your first line of defense against uncommitted production drift.
🏁 Conclusion
The "module conundrum" is a common rite of passage for engineering squads transitioning from monolithic servers to decoupled, containerized workflows. By resisting the urge to force-fit outdated contrib modules or deploy heavyweight enterprise APM suites, architects can deliver clean, resilient, and secure observability with minimal code.
With an event-driven telemetry pipeline, your environments remain strictly isolated behind their firewalls—while your engineering team gains instant, single-pane-of-glass visibility from local WSL2 to production cloud.
Posted by endegraaf | System Architecture & DevOps Engineering | September 19, 2026